Create new dashboard
This section will guide you through creating a new chaos dashboard, and creating custom visualizations for various entities of a chaos experiment.
Before you begin, review the following
Create a new visualization
-
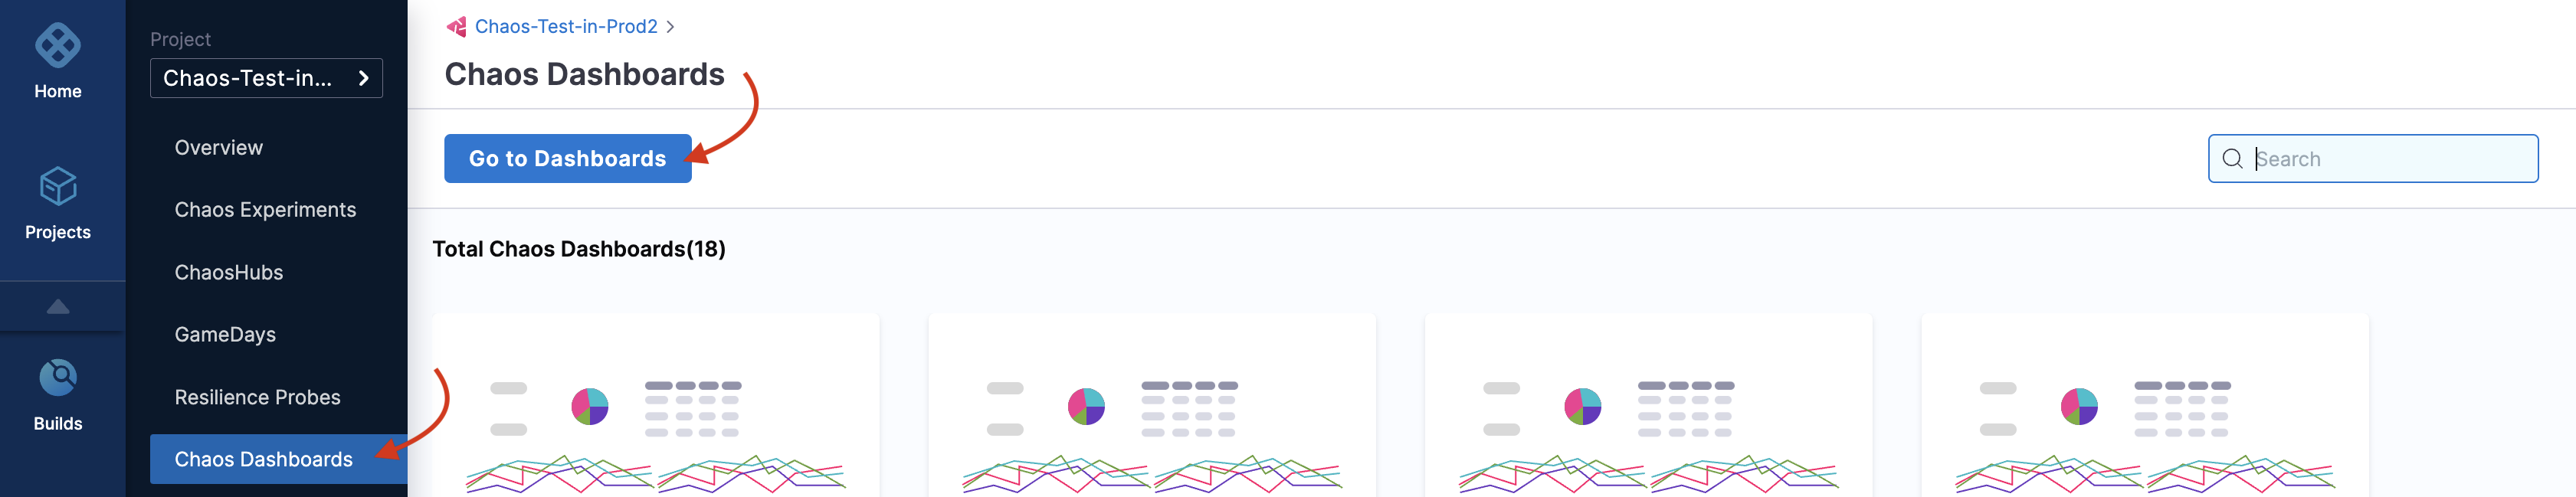
To create a new dashboard, navigate to Chaos Dashboards and select Go to Dashboards.
-
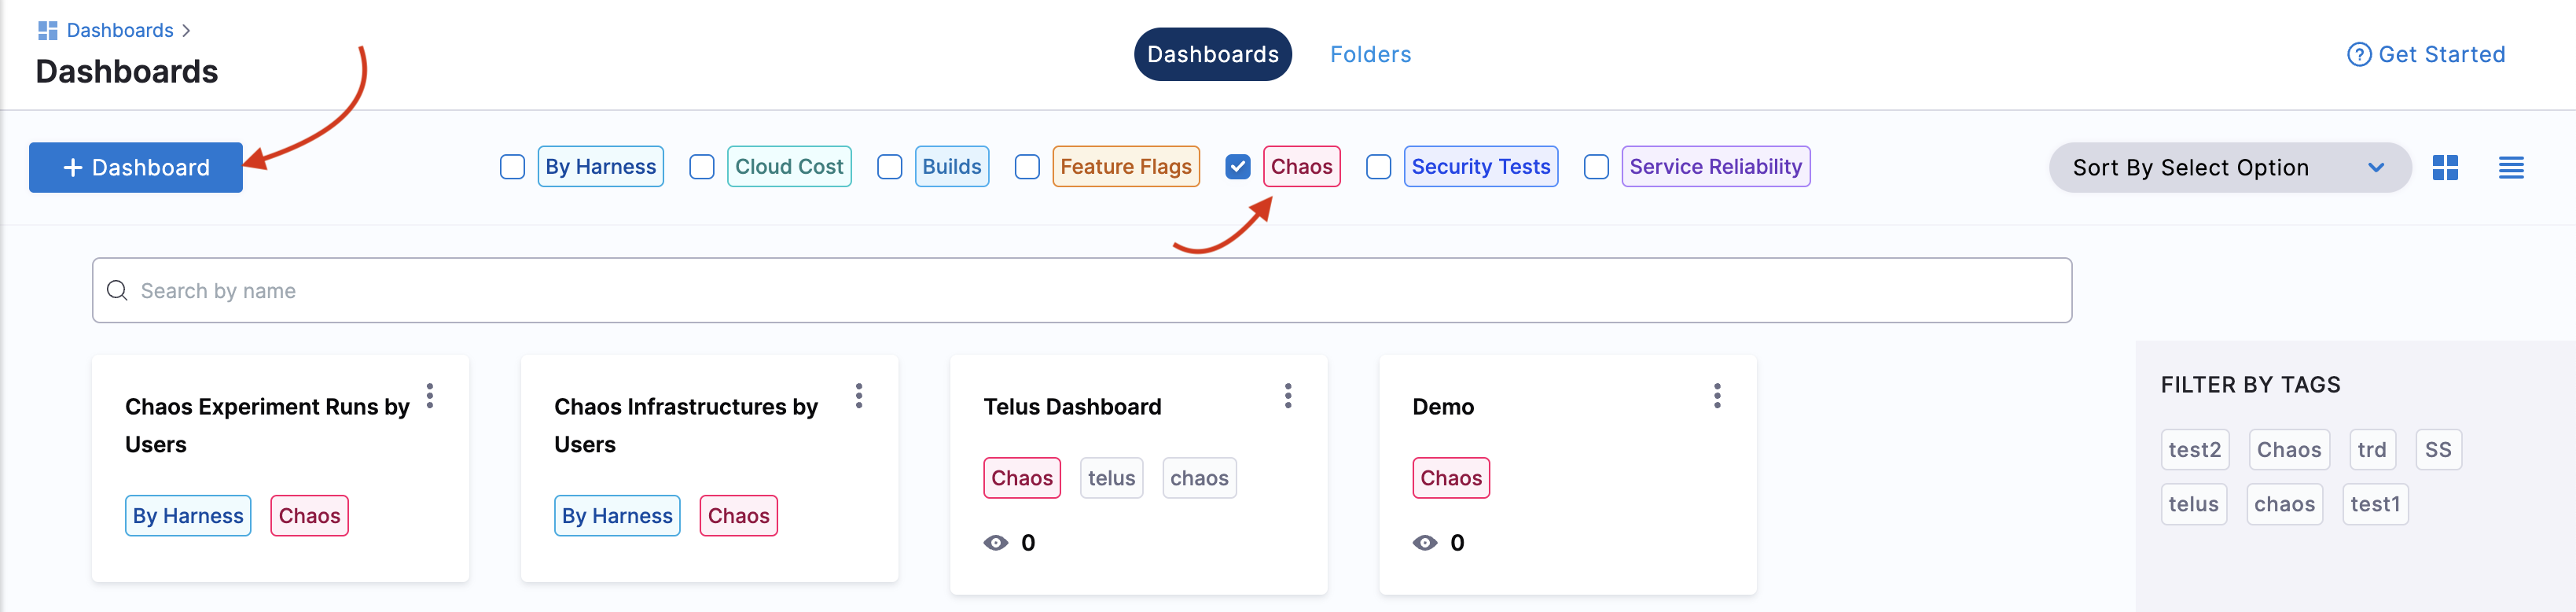
Click + Dashboard, and filter by chaos dashboards.
-
Add values for Folder, Name, and Tags (compulsory).
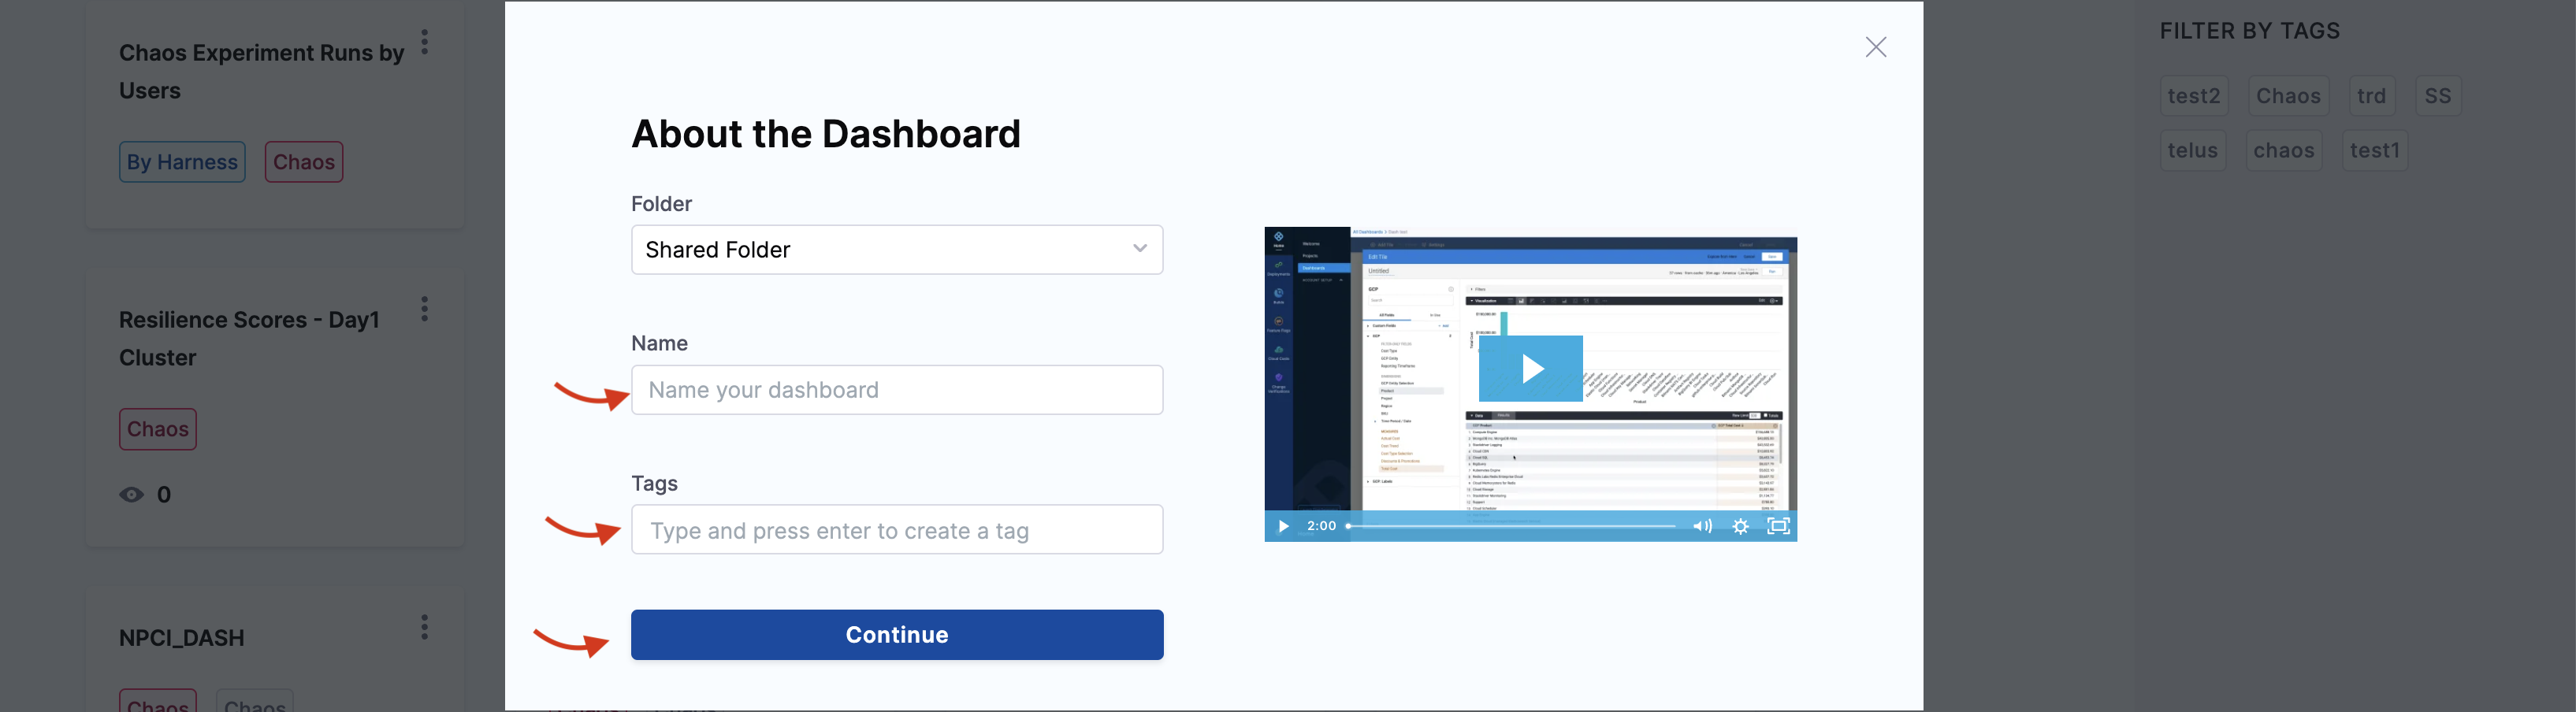
Don't forget to add the Tags value because this is the field based on which the dashboards are filtered by modules.
- Click Continue. This creates an empty dashboard. You can add visualizations (also known as panels) by editing this dashboard.
As mentioned earlier, you can edit a dashboard that you created.
- Click Edit Dashboard to edit the dashboard that you created in the previous step.

- Click Add and select Visualization.

To visualize the number of successful experiment runs for a specific time period (months in this example), you need three fields:
- Count of successful experiments
- Experiment runs
- Months
-
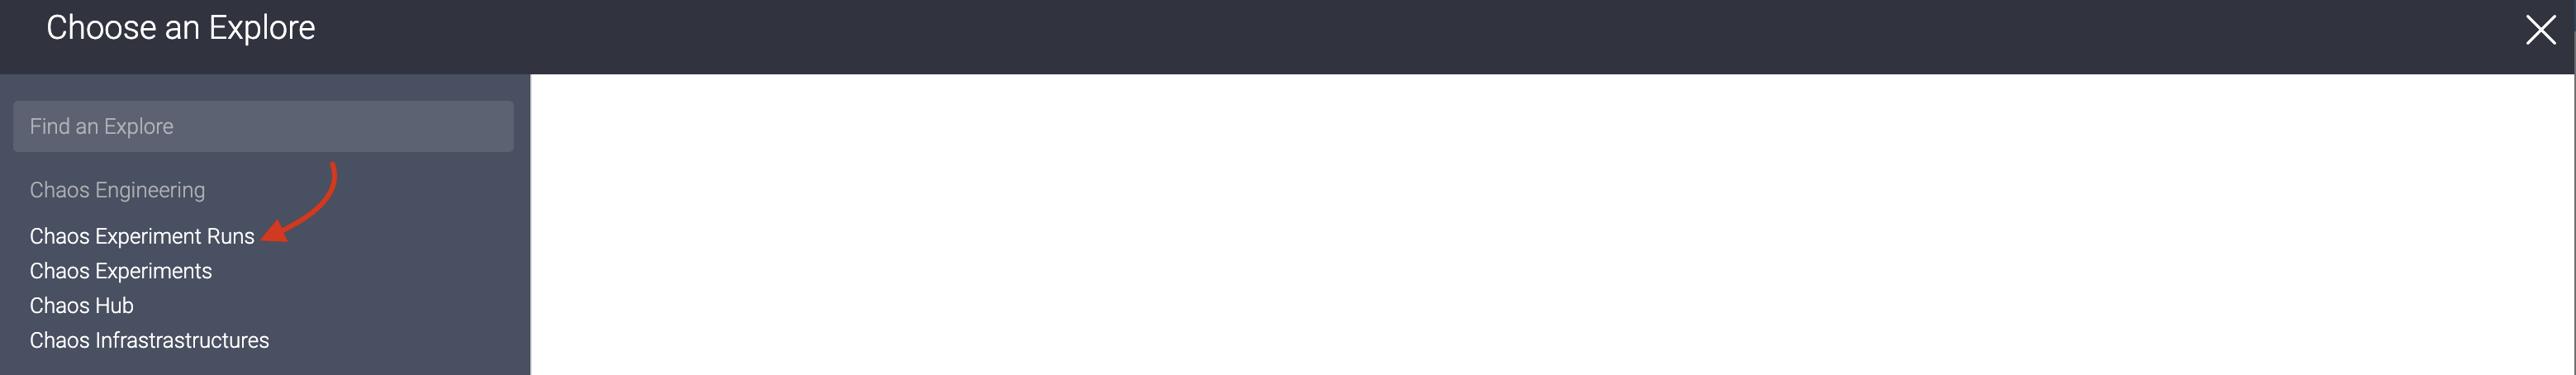
Select a table whose fields you wish to visualize. HCE currently supports Chaos Experiment Runs, Chaos Experiments, Chaos Hub, and Chaos Infrastructures. In this example, select Chaos Experiment Runs.
-
This will display a left bar with different fields.
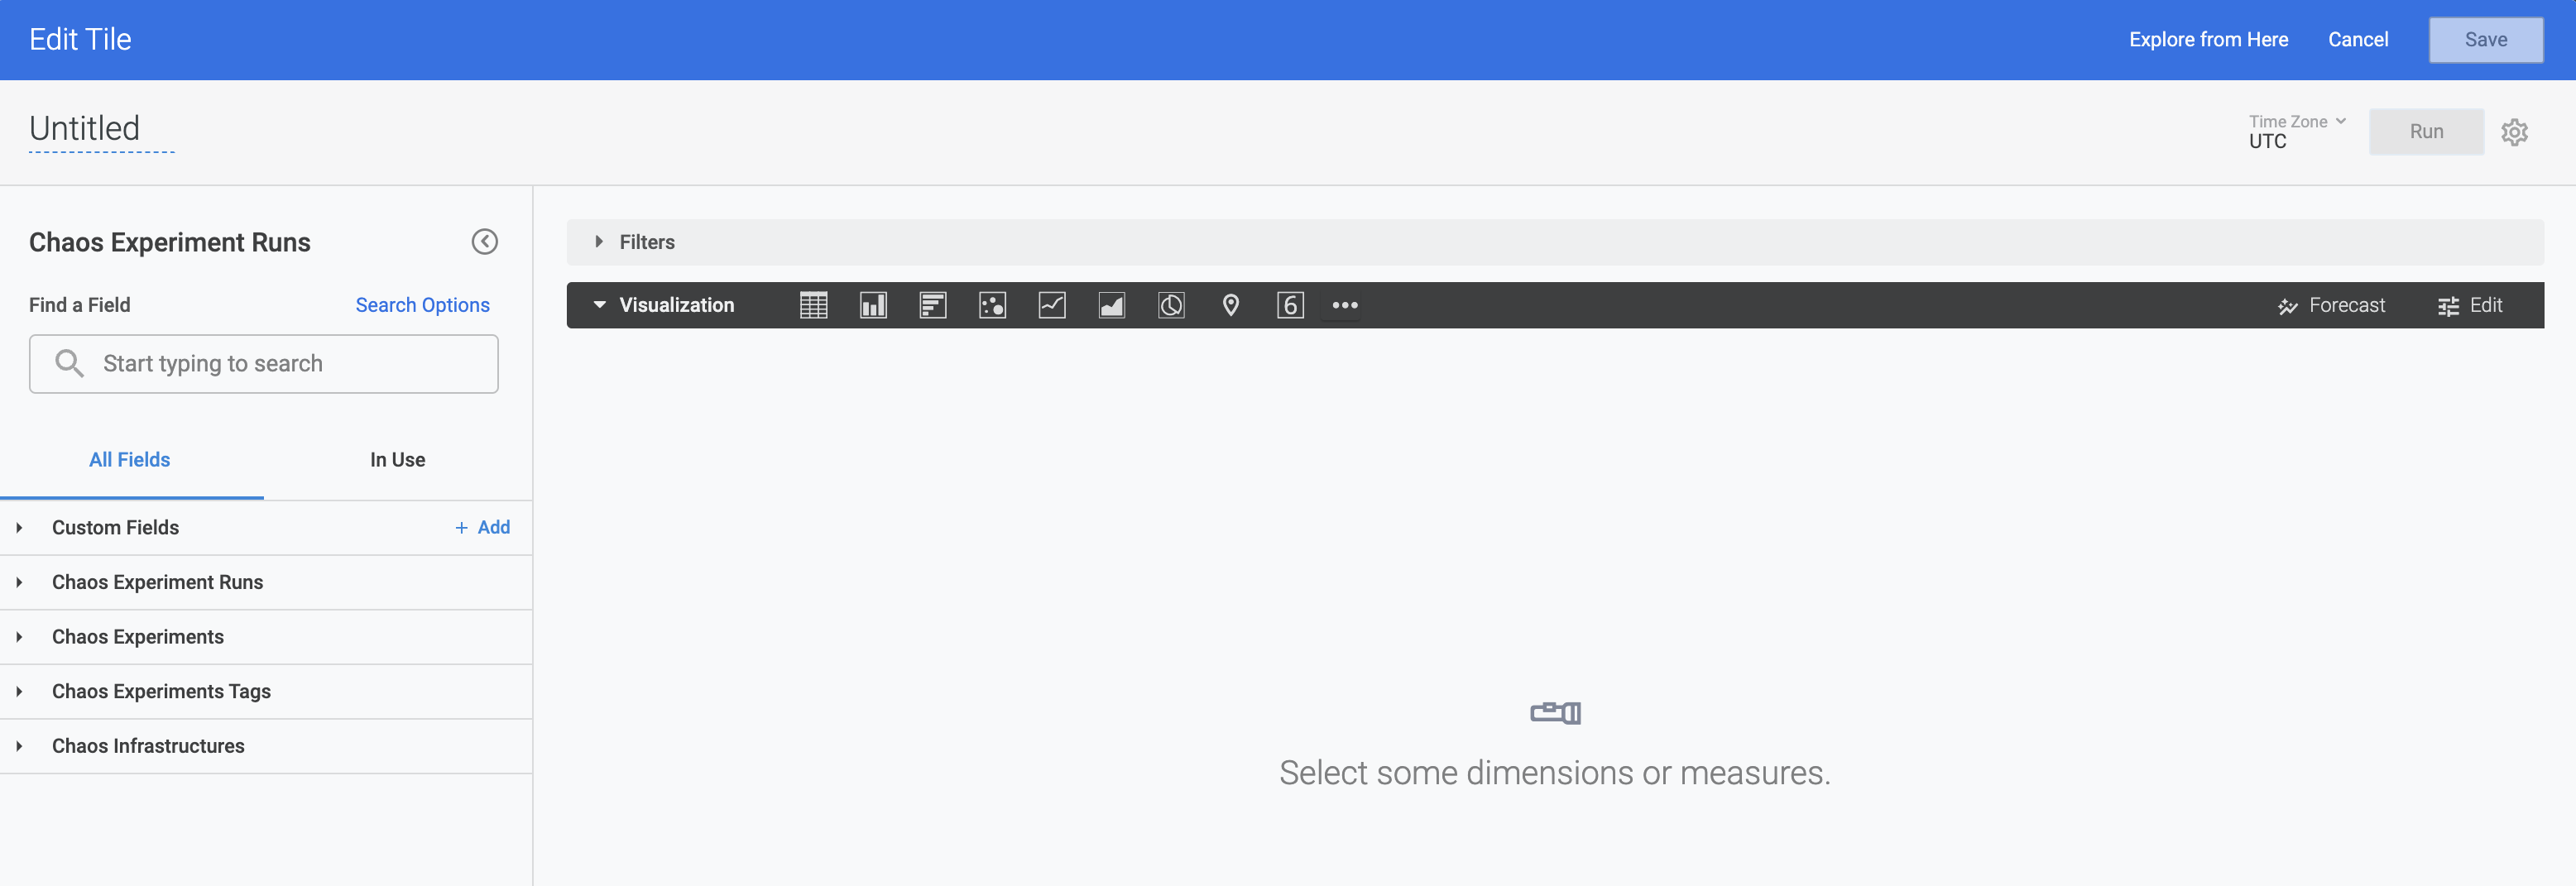
-
Select 2 or more fields which you wish to visualize. In this example, the first field would be Month. To select it, go to Chaos Experiment Runs -> Created time -> Month.
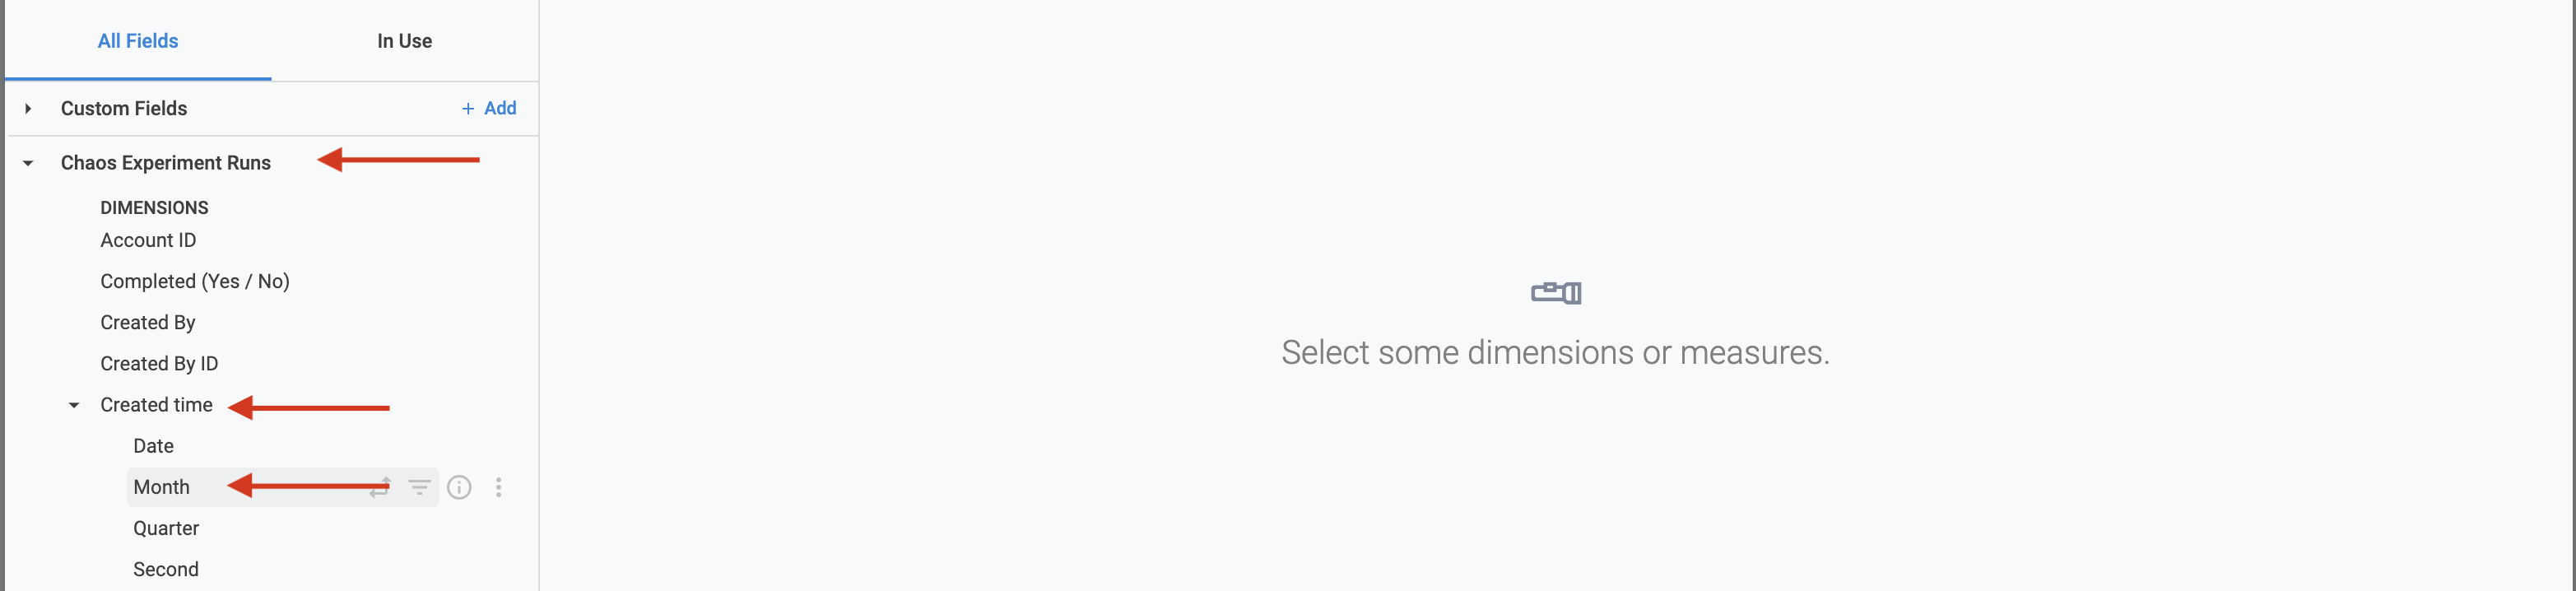
-
The second field would be count.

-
The third field is not readily available, hence you can create a custom field. To create a custom field, click Custom Fields -> Add -> Custom Dimension.
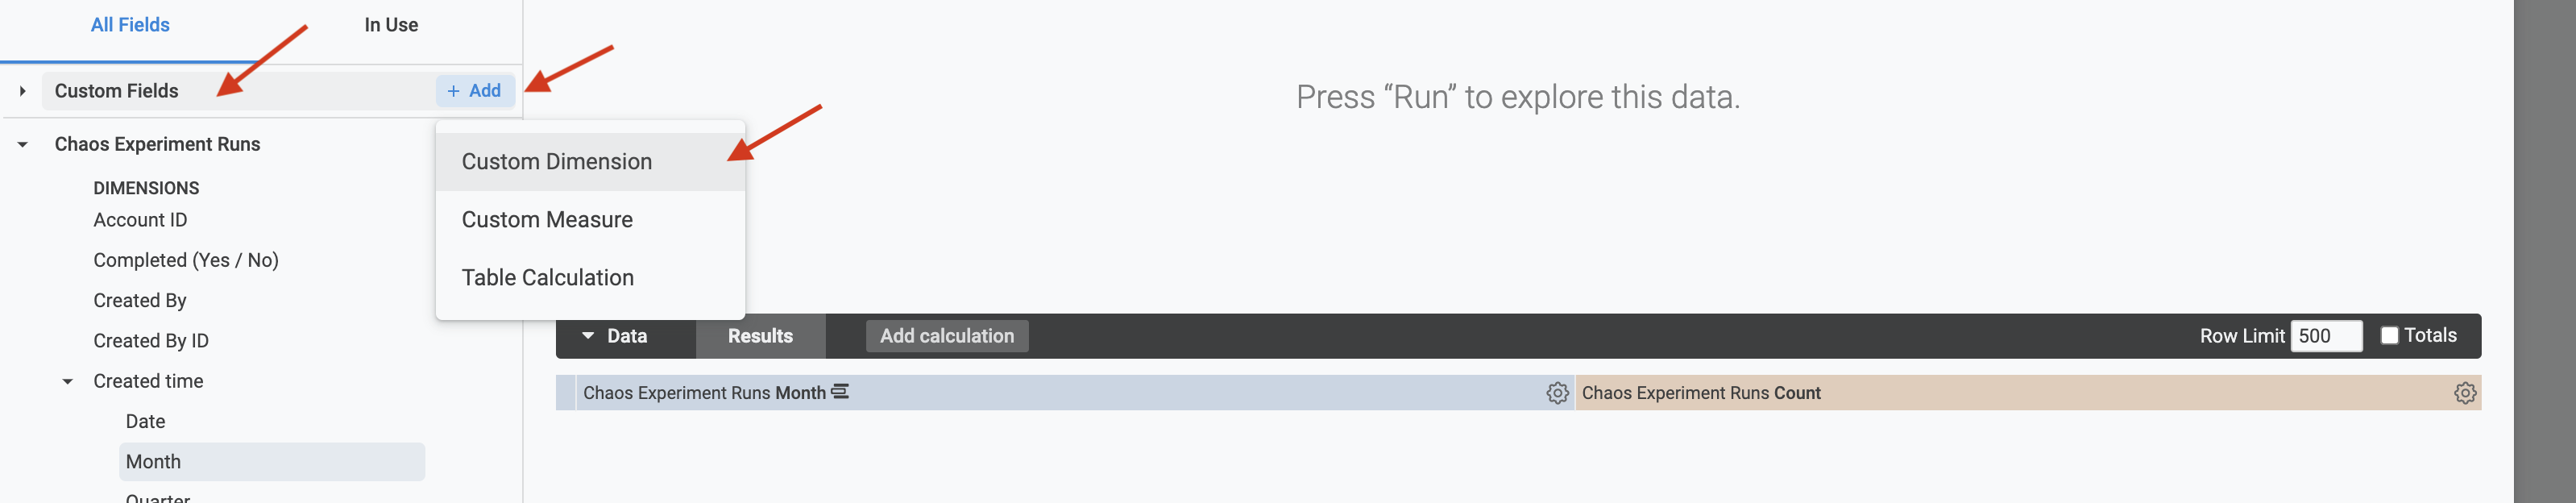
-
To create the query to customize the field, use lookML query. Provide a name and click Save.
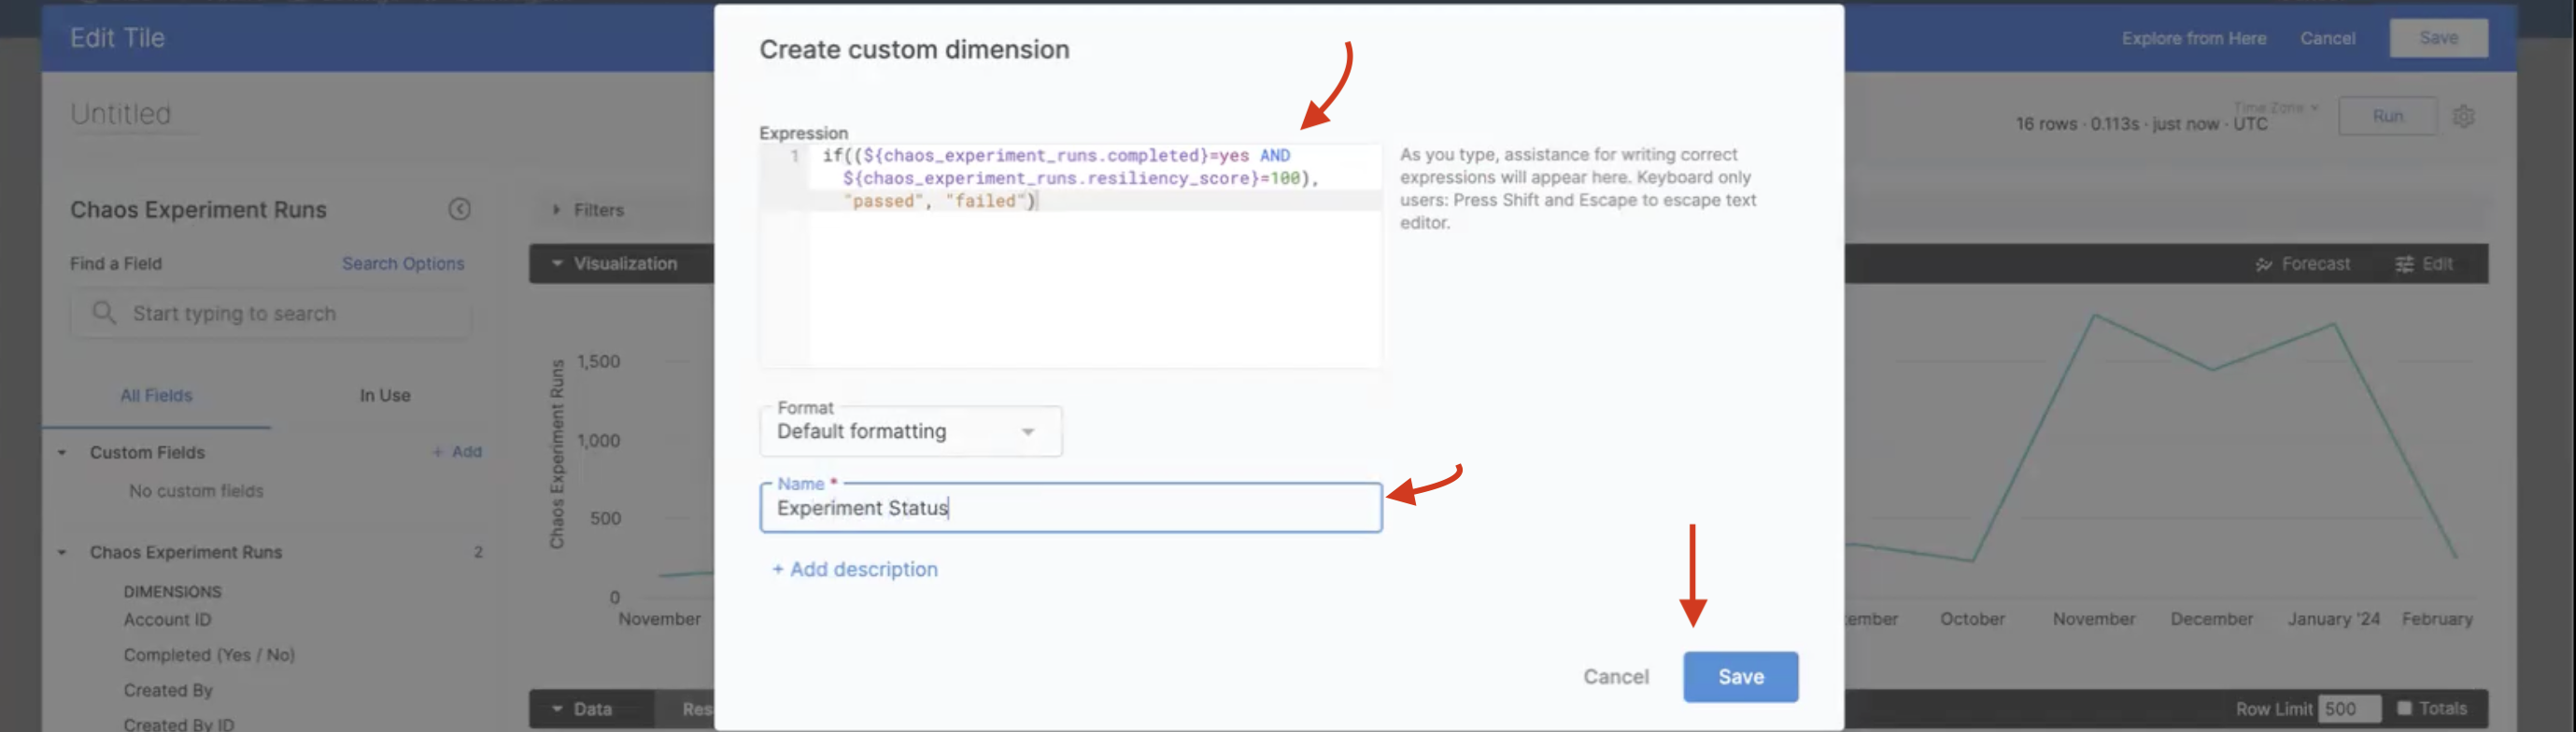
-
To visualize the results with respect to passed and failed experiment runs, click the settings button of the Experiment Status and select Pivot.
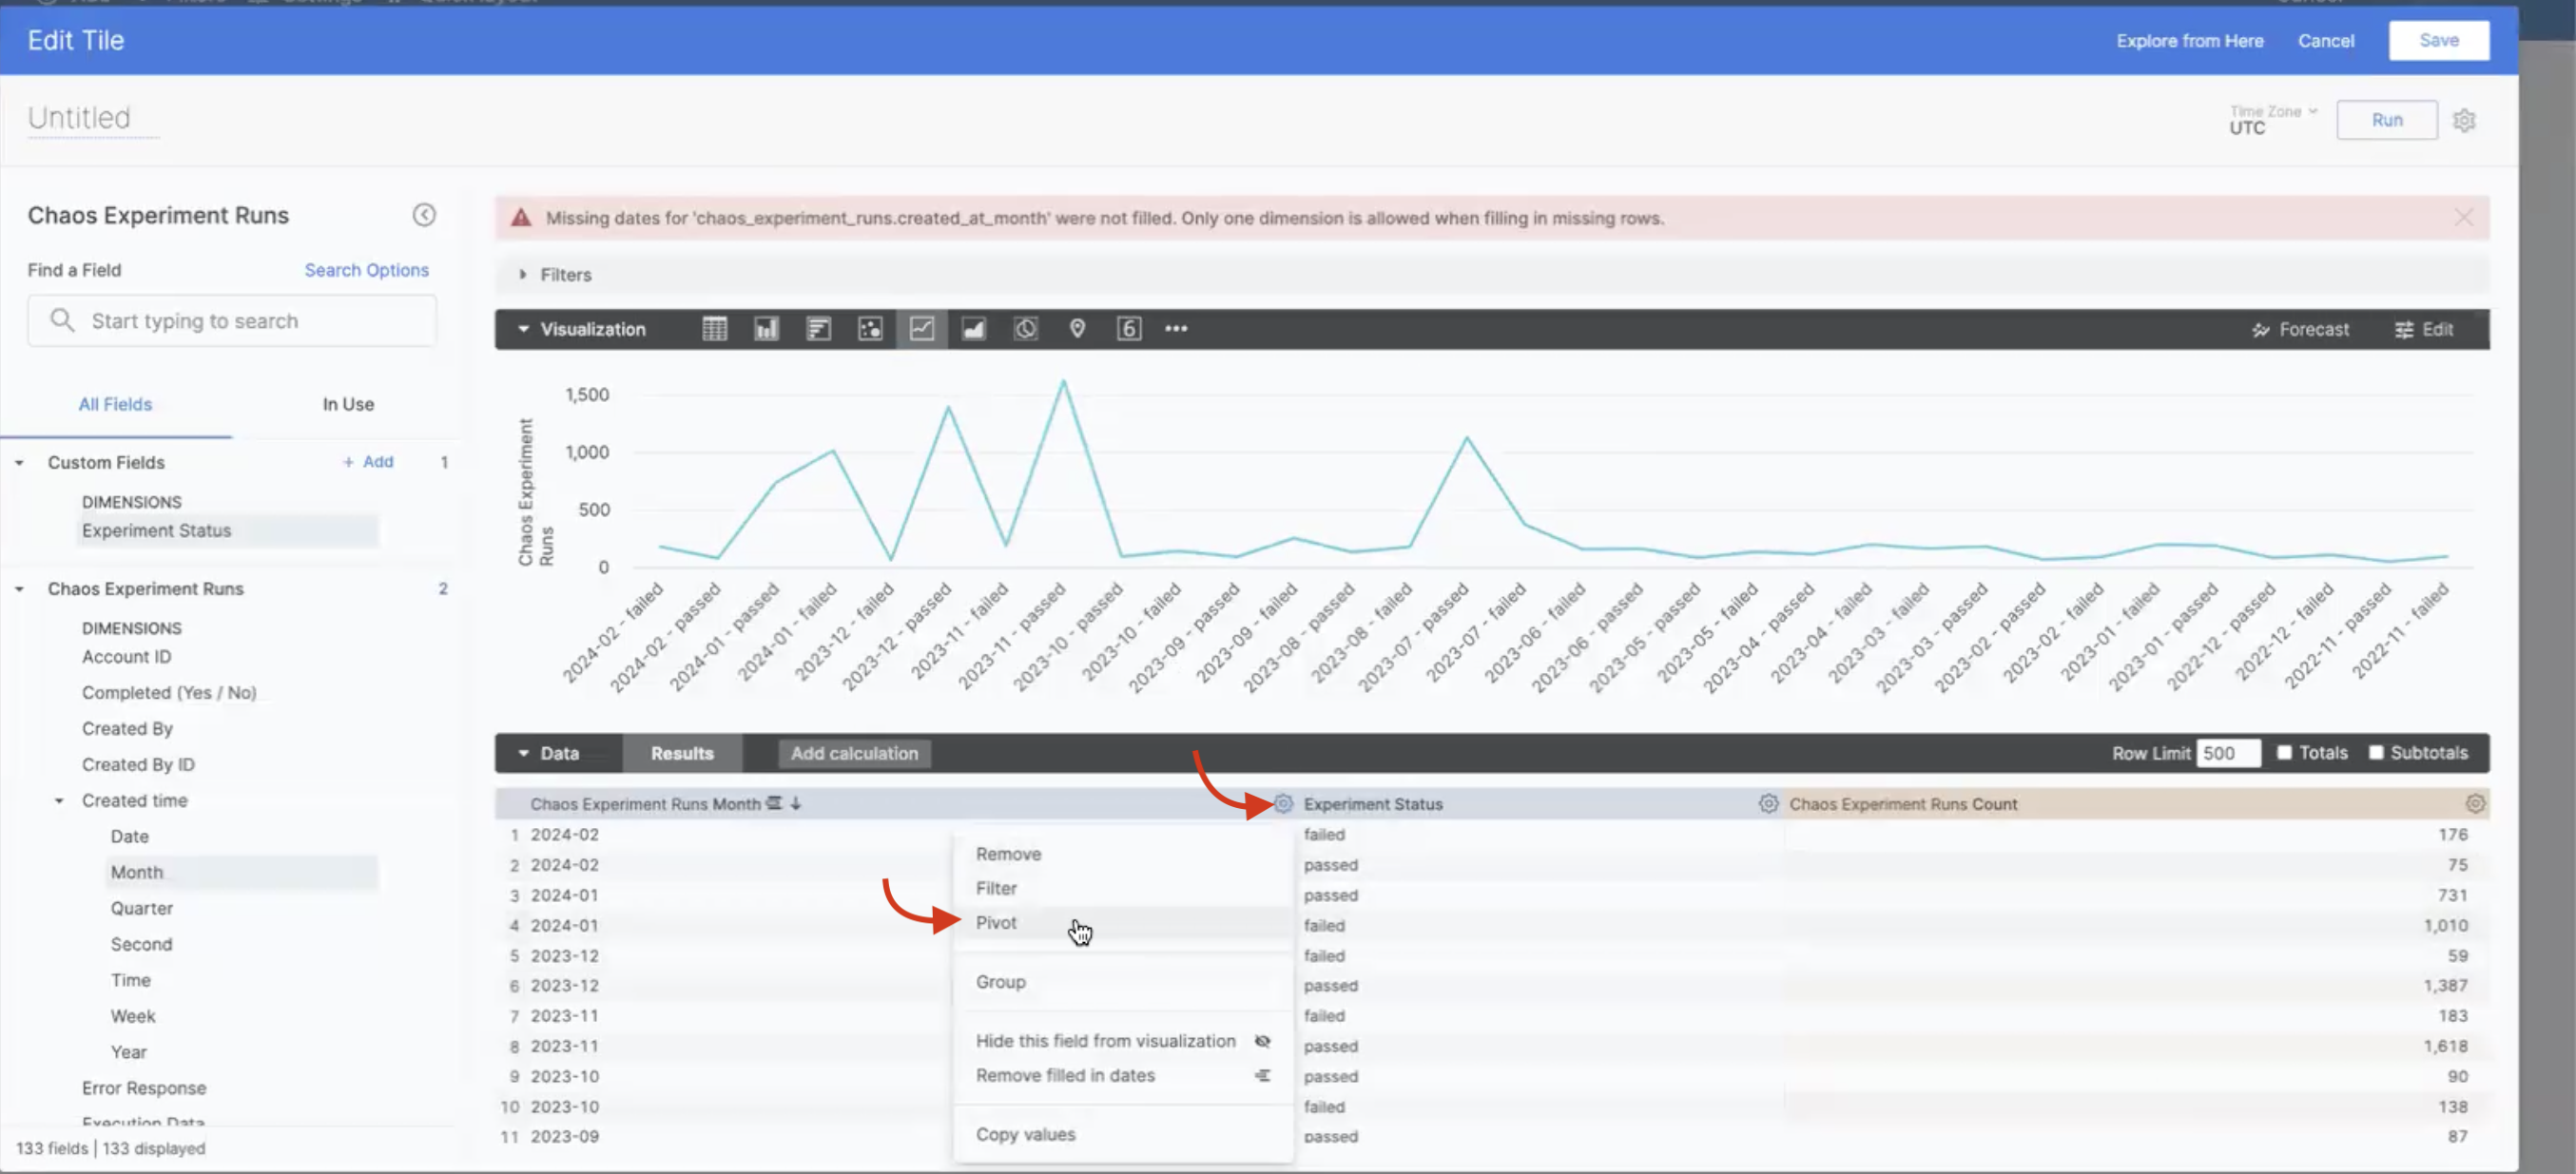
-
When you click Run, chaos dashboard displays the graph of number of failed and passed experiment runs (x-axis) over different months (y-axis).
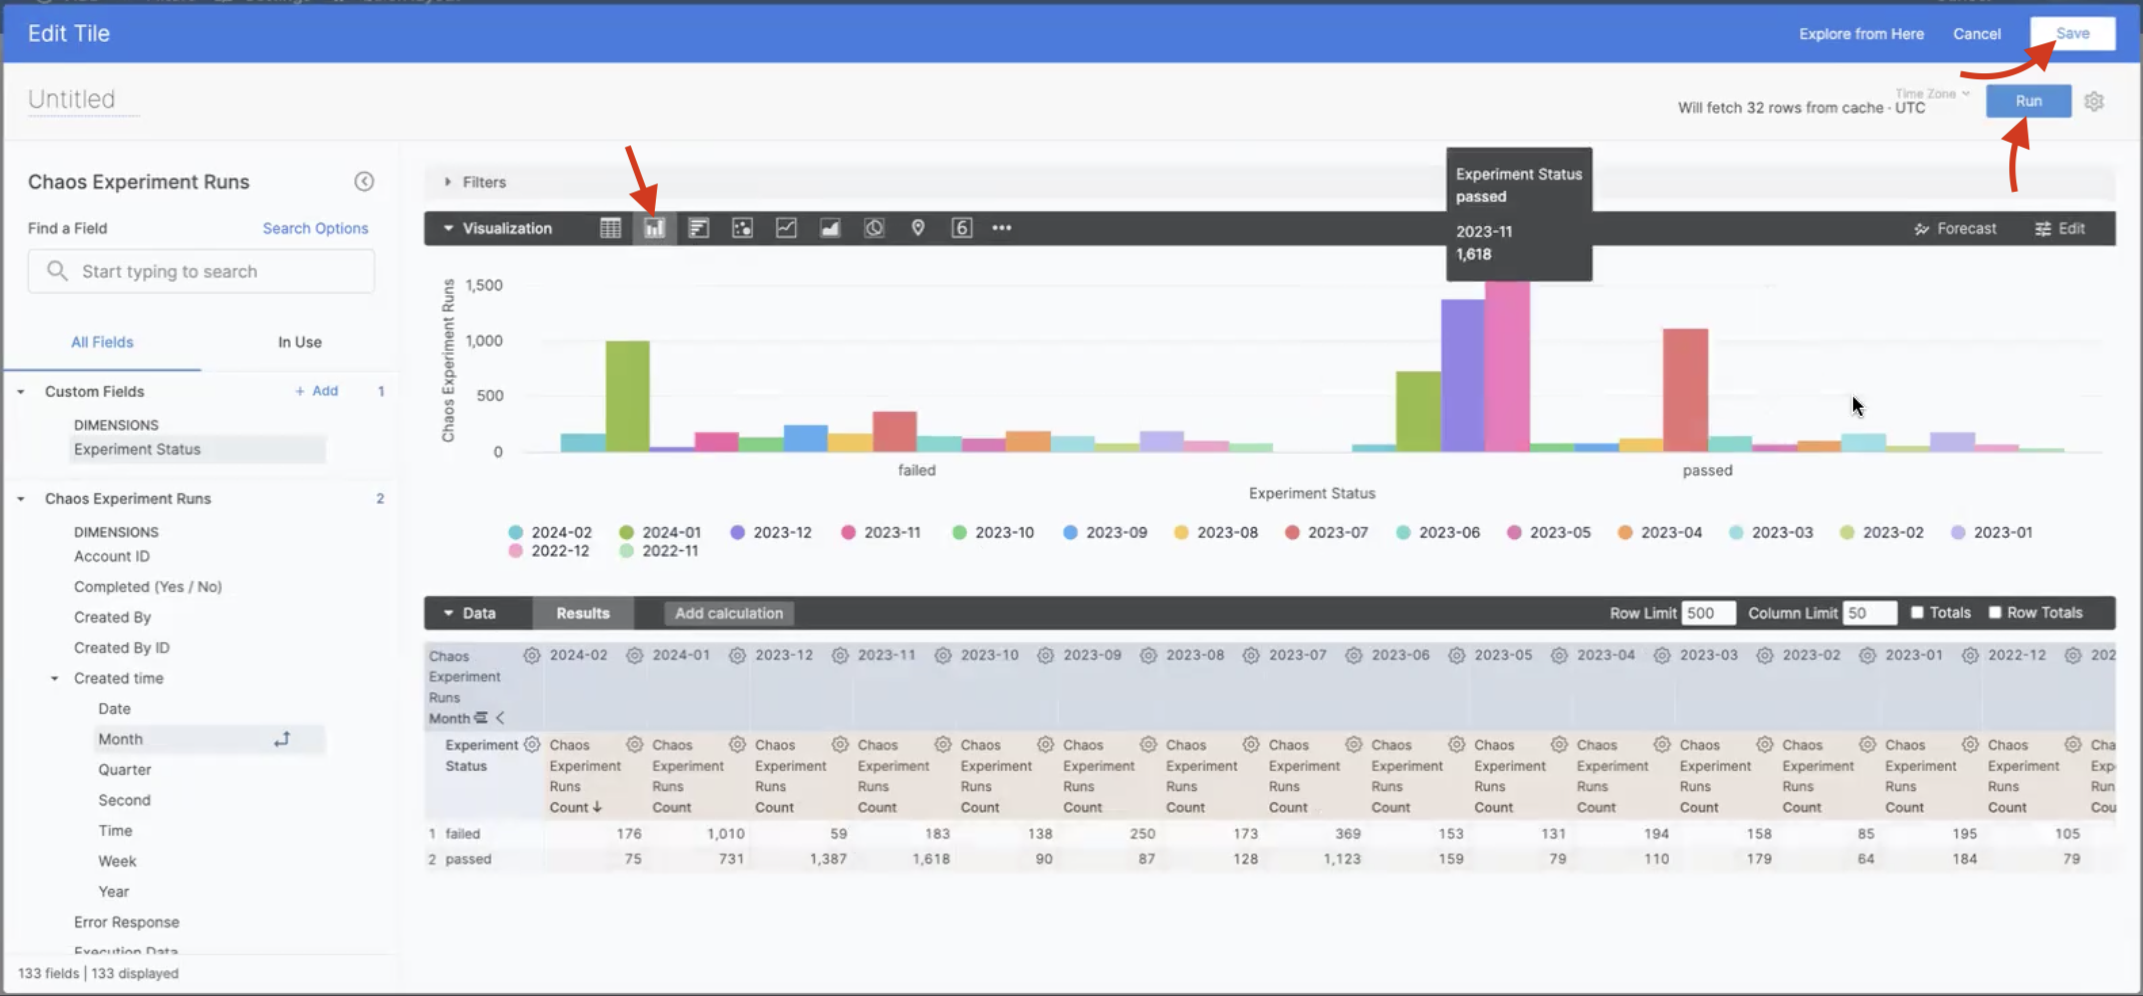
-
If you wish to save your visualization, click Save. Otherwise, you can Cancel and add visualizations again.
Field descriptions
Described below are descriptions of various fields used to plot and analyze data in chaos dashboard.
-
Chaos experiment runs
-
Experiment Run ID: Unique ID associated with every experiment execution (or run) that is created when you create and execute a chaos experiment.
-
Faults awaited: The number of chaos faults that had to wait to complete their execution.
-
Faults failed: The number of chaos faults that did not successfully complete its execution due to variety of reasons like probe failure, infrastructure version issues, and so on.
-
Faults passed: The number of chaos faults that met the conditions and completed its execution.
-
Faults stopped: The number of chaos faults that stopped execution.
-
Resilience score: Value that determines the resilience of your application by considering the number of probes that passed and the number of conditions that were met when a chaos experiment was executed.
-
Total_faults: The total number of faults that executed during a chaos experiment.
-
-
Chaos experiments
-
Cron syntax: The syntax associated with the recurrence of the chaos experiment which is designed to execute the chaos experiment at period time intervals.
-
Experiment type: Whether the chaos experiment is run only once (that is, non-cron) or runs at periodic intervals (that is, cron).
-
Infra type: The type of infrastructure (which can be Kubernetes or Linux), on which the chaos experiment would be executed.
-
Total experiment runs: The total number of times a chaos experiment has run.
-
Name: Unique name of the chaos experiment.
-
Experiment ID: Unique ID associated with a chaos experiment when it is created and saved.
-
-
Chaos infrastructure
-
Infra namespace: The namespace where the chaos infrastructure is installed.
-
Installation type: Whether to enable execution of chaos experiments on an existing infrastructures or on new infrastructures.
-
Last heartbeat time: Latest time of the infrastructure heartbeat to determine if the infrastructure is active or no.
-
Is Active (Yes / No): Whether the chaos infrastructure is active or no.
-
name: The unique name of the chaos infrastructure where you execute the chaos experiment.
-
Service Account: An identity for the chaos experiment that tells about the account in the chaos infrastructure where the experiment is run.
-
Version: The chaos infrastructure version used to execute the chaos experiments.
-
Environment Id: The environment where you create/use existing chaos infrastructure for chaos experiment execution.
-
InfraID: Unique ID associated with a chaos infrastructure when you create a new one.
-
-
ChaosHubs
-
hubId: Unique chaos hub ID associated with a chaos hub
-
hubName: Chaos hub name that you can use to add multiple chaos experiments.
-
Repo branch: The branch of the repository that is associated with the chaos hub.
-
Repo name: The name of the branch in the repository that is associated with the chaos hub.
-
Auth type: The type of authentication used, that is HTTP or SSH.
-
Connector scope: Scope of the ChaosHub connector, which can be project, organization or Account** scope.
-
Is Default (Yes / No): Whether the chaos hub used is a default hub or a custom hub.
-
The fields accountId, orgId, and projectId are common to all descriptors. As the name suggests, the fields mentioned earlier provide a unique identifier for account, organisation, and project, respectively.